Syspower Plus
SKM Market Predictor is broadening its range of services by incorporating advanced features through the SYSPOWER analytical platform.
SYSPOWER Plus is an additional extension package for SYSPOWER users in the Nordics that seamlessly fits into the current SYSPOWER solution, granting users access to more data and analysis capabilities.
Presently, this package includes:
The SYSPOWER Plus package will continue rapidly evolving to adapt to the dynamic market landscape.
Current SYSPOWER Europe subscribers will automatically receive access to the latest features of SYSPOWER Plus as they become available. Other clients interested in trying SYSPOWER Plus can request trial access by providing their contact information below.
Request a trial access to the SYSPOWER PLUS solution
European analysis
The European analysis within SYSPOWER encompasses price forecasts, production, transmission, UMMs, and weather data for key CWE countries and UK.
This data seamlessly integrates into the existing SYSPOWER solution, offering desktop interfaces and facilitating information extraction through the Webquery API.
Presently, the European analysis includes the following datasets, with ongoing plans for gradual expansion:
| DE | PL | NL | UK | FR | AT | BE | CH | |
|---|---|---|---|---|---|---|---|---|
| Spot prices | ||||||||
| Spot prices forecast | ||||||||
| Spot volume | ||||||||
| Spot flow | ||||||||
| Spot flow | ||||||||
| UMM module | ||||||||
| Consumption | ||||||||
| Consumption forecast | ||||||||
| Production | ||||||||
| Exchange | ||||||||
| Temperature | ||||||||
| Temperature forecast | ||||||||
| Wind Production | ||||||||
| Wind Production forecast | ||||||||
| Solar Production | ||||||||
| Solar Production forecast | ||||||||
| Forwards | ||||||||
| EMPS prices | ||||||||
| EMPS balances |
Spot maps
The Spot Overview desktop offers interactive visualization of spot market settlement dynamics in the Nordic/Baltic and CWE countries. This includes graphical representation of exchange flows, transmission constraints, spot balances, and supply and demand curves at the country level.
Customers can conveniently access and download all this data via the SYSPOWER WebQuery API.

The tool is highly valuable for analyzing spot price settlements on an hourly basis immediately after daily results are released by power exchanges.
Gas market data
The Gas Market Data desktop offers comprehensive details on supply, demand, and storage data from major European gas markets.
This data can be smoothly incorporated to analysis alongside all power market data available in SYSPOWER desktops and is accessible for downloading through the SYSPOWER WebQuery API.

We intend to progressively enhance and broaden the scope of gas market data and analysis in the future.
EMPS detailed data
The EMPS Overview desktop features an interactive interface presenting weekly EMPS runs for Nordic/Baltic and CWE regions. It provides detailed data on production, power balances, and prices for each stochastic scenario extending up to five years into the future.
This desktop offers exceptional opportunities to analyze comprehensive fundamental data across various price areas. All underlying data can be downloaded through the SYSPOWER WebQuery API, enabling users to create customized analyses based on this information.

Long-term price forecasts from the EMPS model including captured prices, and analytical reports, is accessible through the SYSPOWER LTPO module (subject to separate subscription)
Intraday data
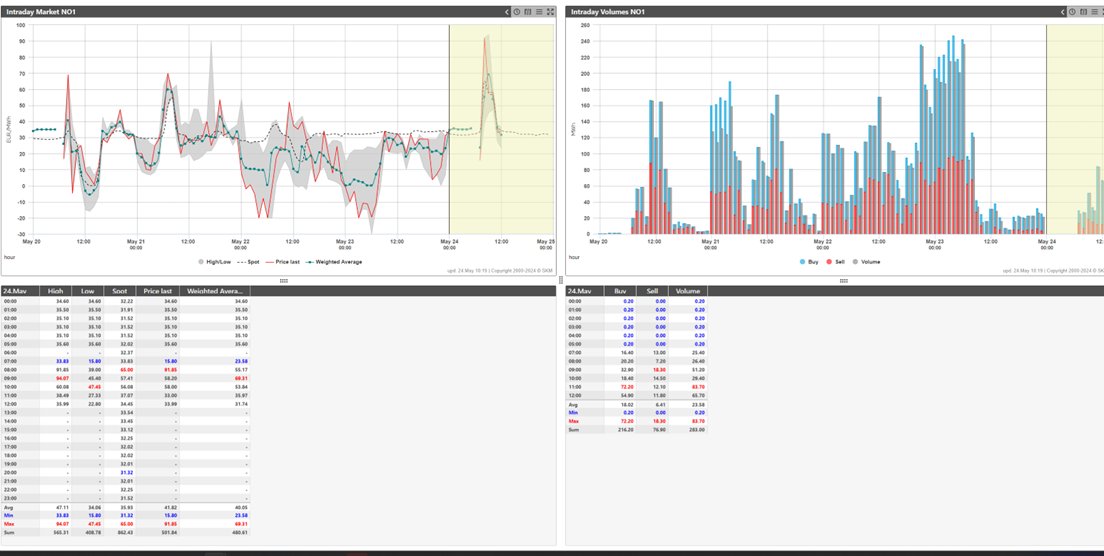
Access 15-minute delayed SIDC (Single Intraday Coupling) continuous price and volume data for the Nordic and Baltic regions. The dataset includes key metrics such as last, high, low, and average prices, as well as market buy and sell volumes.
This data is integrated into Syspower Analytical desktops, enabling comprehensive analysis alongside other fundamental market data. Additionally, it is available for download through the Syspower Webquery API.

If you have any questions about this product please contact us using contact information in the right column.


